


Abstract
Transposable elements (TEs) represent a major fraction of plant genomes and drive their evolution. An improved understanding of genome evolution requires the dynamics of a large number of TE families to be considered. We put forward an approach bypassing the required step of a complete reference genome to assess the evolutionary trajectories of high copy number TE families from genome snapshot with high-throughput sequencing. Low coverage sequencing of the complex genomes of Aegilops cylindrica and Ae. geniculata using 454 identified more than 70% of the sequences as known TEs, mainly long terminal repeat (LTR) retrotransposons. Comparing the abundance of reads as well as patterns of sequence diversity and divergence within and among genomes assessed the dynamics of 44 major LTR retrotransposon families of the 165 identified. In particular, molecular population genetics on individual TE copies distinguished recently active from quiescent families and highlighted different evolutionary trajectories of retrotransposons among related species. This work presents a suite of tools suitable for current sequencing data, allowing to address the genome-wide evolutionary dynamics of TEs at the family level and advancing our understanding of the evolution of nonmodel genomes.
Introduction
The sequencing of multiple plant genomes has dramatically improved our understanding of the impact of whole-genome duplication and transposable elements (TEs) on the organization of angiosperm genomes (Kejnovsky et al. 2009). Notably, single or low-copy sequences (e.g., functional genes) often comprise a modest fraction of genomes, whereas repetitive sequences form a major component (Hua-Van et al. 2011). In particular, interspersed TEs are typically found at multiple copies in intergenic regions and form the most dynamic fraction of genomes (Gaut and Ross Ibarra 2008). The episodic activation of such intragenomic parasites and mutations associated with inserted copies play a pivotal role in fuelling host genome reorganization and, ultimately, biological diversification (Feschotte et al. 2002; Kazazian 2004). TEs have the ability to affect genome structure and function through transposition, ectopic recombination and epigenetic repatterning (Bennetzen 2005; Slotkin and Martienssen 2007; Parisod et al. 2009; Fedoroff 2012). To what extent TEs shall be considered “junk DNA” when compared with functional sequences under direct selection remains a matter of debate and their impact on genome evolution deserve further attention (Biemont and Vieira 2006).
TEs represent a very diverse community of sequences that fundamentally differ in their mechanism of transposition: Class I retrotransposons move via “copy and paste” mechanisms using RNA intermediates, whereas Class II DNA transposons move via “cut and paste” mechanisms through DNA intermediates (Wicker et al. 2007). Lower levels of the TE classification are based on the number of DNA strands transferred from the original to the insertion site (i.e., subclasses), insertions mechanisms (i.e., orders), and DNA sequence similarity (i.e., families). Individual insertions (i.e., particular TE copies at specific chromosomal locations) represent the lowest level of this hierarchy (Le Rouzic et al. 2007). Related TE copies from a given family inhabiting the host genome are considered here as a population, and such TE populations can show dramatically different evolutionary trajectories in different species (e.g., Parisod et al. 2012). As the various TE families within a genome may show distinct trajectories (e.g., Baucom et al. 2009; Choulet et al. 2010), the dynamics of several TE families should be simultaneously addressed to further understand the evolution of this major genome fraction through comparative approaches (Brookfield 2005a).
Long terminal repeat (LTR) retrotransposons represent the predominant order of TEs in plants (Kumar and Bennetzen 1999). The life cycle of LTR retrotransposons involves the reverse transcription of a RNA intermediate from a mother copy, and such TEs can potentially amplify within the host genome by inserting several daughter copies at multiple sites (Sabot and Schulman 2006). The balance between genome expansion through TE proliferation and contraction through deletion of TE sequences drives variation in genome size and organization (Bennetzen and Kellogg 1997; Vitte and Panaud 2005; Sabot and Schulman 2006; Tenaillon et al. 2010). Accordingly, the replicative proliferation of a single, active copy of LTR retrotransposon generates a population of closely related sequences, with most copies sharing high genetic similarity within a genome (Casacuberta et al. 1997). In contrast, TE populations originating from older proliferation events are genetically heterogeneous due to accumulation of mutations. Most copies of a given TE family detected from genomic sequences are indeed defective, presenting premature stop codons, indels, or further rearrangements such as truncation or nested insertions (SanMiguel et al. 1996). Populations of genetically heterogeneous copies are predicted for inactive TE families and patterns of sequence diversity assessed from large amounts of TE sequences distinguish recently active from quiescent TE lineages (Brookfield 2005b).
The central features of TEs, abundance and dynamics, result in challenges for comparative genomics (Treangen and Salzberg 2012). In particular, repetitive TEs create ambiguities in alignments and assemblies of short sequences (e.g., data typically produced from so called next-generation sequencing), which prejudice meaningful interpretations and hinders large-scale sequencing of complex genomes (Berkman et al. 2012). TEs are central to genome evolution and shall not be simply ignored, but most studies investigating TE genome fractions have had to focus on selected genome regions (SanMiguel et al. 2002; Li et al. 2004; Sabot et al. 2005; Choulet et al. 2010). Accordingly, only a subset of the significant TE diversity is potentially identified and the dynamics of TEs may be intermingled with the evolutionary history of the loci under scrutiny. Efficient approaches, assessing TE dynamics at a genome-wide scale without having to rely on complete reference genomes, are thus currently required.
Here, we put forward a procedure inferring the genome-wide evolutionary dynamics of TE families from low-coverage sequencing data, thus bypassing the required step of a fully assembled genome. We used the Triticeae clade of the grass family (i.e., the genus Aegilops that is closely related to cultivated wheat), because these species harbor complex genomes containing 80% of well-annotated TEs, with a majority of LTR retrotransposons (Li et al. 2004; Sabot and Schulman 2009; Wicker and Buell 2009). We produced genome snapshots of Aegilops cylindrica (genome DC, 9398 Mb per 1C) and Ae. geniculata (genome UM, 10074 Mb per 1C) by 454 pyrosequencing with the aims to 1) identify and quantify the proportion of the genome occupied by the different TE families at the genome-wide scale and 2) assess the evolutionary dynamics of the major LTR retrotransposons in species having different genome content but close sizes (van Slageren 1994; Eilam et al. 2008). We show that the genomes of wild wheats are composed of a majority of LTR retrotransposons from more than 160 families with a couple of dominant ones. In addition to differences in abundance among host genomes, several TE families presented genetically divergent but homogeneous populations of individual copies, indicating species-specific proliferation. This approach thus offers appropriate tools to distinguish recently active from quiescent TE families and address the processes underlying the evolution of TE genome fractions from patterns of genetic diversity among copies. With the advent of short reads sequencing, it will advance the genomics of model and nonmodel species.
Materials and Methods
Plant Material
Accessions of Ae. cylindrica (TA 2204 = AE 719) collected in Armenia and of Ae. geniculata (TA 1800) collected in Turkey (Kirkareli) were obtained from the Wheat Genetics Resource Center (Kansas State University, USA). These accessions have been previously characterized at the cytogenetic level, assessing chromosomal rearrangement, amplification, and deletion of repetitive sequences (Badaeva et al. 2004; Linc et al. 1999). Plants were grown under controlled conditions (18 °C, 18 h light), and leaves were collected on 2-week-old seedlings. Genomic DNA was extracted from fresh leaves following a standard cetyltrimethylammonium bromide protocol (Chen and Ronald 1999).
The exact phylogeny of Aegilops remain poorly resolved and dated (Baum et al. 2012), but diploid Aegilops and Triticum species apparently diverged within the last 2.5–4.5 Myr (Huang et al. 2002), whereas Triticum diverged from barley 11 Ma (Bossolini et al. 2007), from Brachypodium approximately 35 Ma, and from rice and maize some 60 Ma (Wolfe et al. 1989).
Whole-Genome Snapshot and Sequence Classification
Approximately 40 ng of genomic DNA of one individual per accession was mechanically shotguned, and random fragments were sequenced on half a plate of the Roche 454 GS FLX titanium platform (service provided by Microsynth, Switzerland, following manufacturer’s instructions). The quality of reads was checked with PRINSEQ v0.20.1 (Schmieder and Edwards 2011) and revealed normally distributed GC content (ranging from 30% to 70%) and Phred quality score (25–40). Less than 6% of the reads presented ambiguous bases occurring over less than 1% of the sequence. Accordingly, no further trimming of the 454 reads than the standard quality trim offered by sffTools was required. Reads showing strong bias of bases distribution compared with random expectations (i.e., classified as simple sequence repeat [SSR] using personal scripts described in Wicker et al. [2009]) were removed. Identical sequences starting within two nucleotides of one another were further identified with 454 Replicate Filter (Gomez-Alvarez et al. 2009) and represented a negligible 1% of the reads that may be artificially replicated fragments during sequencing.
To determine the sequence composition, 454 reads (SSR excluded) were subjected to Basic Local Alignment Search Tool (BLAST) analyses against various databases and consecutively classified as repetitive element sequences (using complete TREP: wheat.pw.usda.gov/ITMI/Repeats/), organelle, and coding sequences (using TIGR rice genome version 5: rice.plantbiology.msu.edu and RAP-DB: rapdb.dna.affrc.go.jp), using personal scripts described in Wicker et al. (2009) (fig. 1). To identify TEs, complete TREP was preferred, as this curated database includes known copies rather than consensuses of 584 TE families mostly from barley and cultivated wheat. Complete TREP included thus variation within TE families from species related to those investigated here. BLASTN searches identified hits showing 80% similarity with sequences from databases and selected hits with e values < 10E-6. As BLASTN retrieved numerous hits, BLASTX search was not required. Classification of TE families into classes, orders, superfamilies, and families was consistent with Wicker et al. (2007). Noticeably, rare or a priori unknown families may be overlooked with this approach, but it could be nicely complemented by clustering (e.g., Novák et al. 2010) or assisted automated assembly (DeBarry et al. 2008), allowing to potentially describe new TE families.
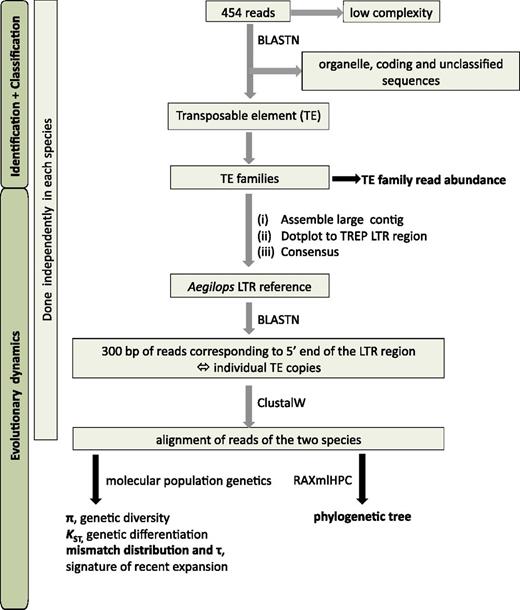
Overview of the approach used here to identify and classify 454 reads into families of TEs, and then investigate their evolutionary dynamics through molecular population genetics.
Abundance of the different TE families among the two species with close genome size was estimated as proportions of reads matching the different TE family out of the total number of reads. To assess possible sampling effects on estimated proportions, vectors with assignments of reads to TE families were resampled 999 times with replacement to estimate the distribution of proportions using the sample function in R Cran. In addition, 95% confidence intervals were further assessed under binomial distribution theory, using Wald’s method for large numbers with the binCI function in the package binGroup in R Cran. Both estimates closely correlate, confirming that resampling estimates agree with the full multinomial distribution of all TE families considered together. Accordingly, resampling 95% confidence intervals around the mean proportions presented here allowed to identify TE family with nonoverlapping intervals and thus with significantly different abundances.
Evolutionary Genetics of TE Populations
Reads corresponding to TE copies were retrieved and analyzed through a pipeline summarized in figure 1. For each TE family, we have reconstructed LTR regions of our Aegilops species instead of using LTR regions from TREP. Accordingly, 454 reads that initially matched against entries from TREP were assembled in large contigs with phredPhrap (www.phrap.org/), and contigs corresponding to TREP LTR regions were identified using DOTTER in LINUX. Majority rule consensuses were edited to make Aegilops LTR references.
Portions of reads corresponding to the first 300 bp at the 5′-end of the LTR region and thus corresponding to individual TE copies for each family were identified by BLASTN against Aegilops LTR references. Given the large genome of Aegilops and the low coverage of our sequencing, the probability of retrieving the same TE copy among the reads is negligible. Sequences flanking the 5′-end of LTR region were checked and were mostly different from one another (flanking sequences that were nearly identical corresponded to the 3′-end of the internal region) (data not shown). Accordingly, analyzed reads corresponding to a short portion (here, 300 bp) of the TE can be assumed to represent individual TE copies. Our 454 reads had an average length of 380 bp. We selected portions of 300 bp, because large reads guarantee better resolution for subsequent analyses. Individual reads from each species were then merged and aligned using ClustalW. Alignments were manually edited if necessary. Using own Aegilops LTR references instead of LTR regions available in databases minimized potential bias due to divergence between TEs from Aegilops and those described in TREP (i.e., mainly from Triticum) and allowed collecting a larger sample of reads.
To assess LTR retrotransposon families showing evidence of recent proliferation within genomes, patterns of genetic diversity among independent 454 reads corresponding to the 5′-end of the LTR region were investigated for each TE family. The 5′-end of the LTR region is a variable and diagnostic portion of retrotransposons that includes both autonomous and nonautonomous elements, but other regions such as the reverse transcriptase domain may also offer suitable resolution. Assuming that reads represent independent copies and considering the genomes of the different accessions as distinct TE populations, we used molecular population genetics approaches to estimate significant parameters highlighting the evolutionary dynamics of TE families. Our method is based on the identification of groups of TE copies sharing higher genetic similarity than otherwise observed among copies of quiescent TE families that accumulated genetic differences to highlight recent proliferation events.
Phylogenetic Inferences
Phylogenetic relationships among copies of each TE families were investigated by inferring an unrooted maximum likelihood trees with high performance computing using RAXmlHPC (general time reversible model with gamma-distributed rate across sites; branch support assessed by 100 bootstraps; Stamatakis 2006). No specific gap coding was done because indels were mostly 1 bp long.
Genetic Differentiation between TE Populations
Genetic differentiation among individual copies of the TE populations (i.e., host genomes) was assessed by the fixation index (KST), representing the proportion of genetic diversity that is observed between populations out of the total diversity (Holsinger and Weir 2009). A low KST indicates that the TE populations mostly share similar TE copies, whereas higher KST means greater differentiation between TE copies inserted in the different genomes. KST was estimated with the Tamura and Nei distance between sequences using Arlequin version 3.5 (Excoffier et al. 2005). Whether KST was significantly different from zero was tested by permuting haplotypes between populations 100 times, giving the null distribution of pairwise KST values under the hypothesis of no difference between populations. The proportion of permutations leading to a KST value larger or equal to the observed one represents the P value. In addition, the nucleotide diversity (π) among the sequences in the two species was evaluated using DnaSP v5 (Librado and Rozas 2009).
Molecular Signature of TE Expansion
Within TE families, the presence of groups of similar TE copies indicative of recent expansion can be highlighted through the analysis of the mismatch distribution of distance among sequences (i.e., the proportion of pairwise nucleotide differences; Schneider and Excoffier 1999). TE copies after expansion indeed share genetic differences, resulting in unimodal distributions of pairwise differences. Given the biology of TEs, bimodal distributions may be expected following successive waves of expansion, with secondary peaks characterizing prior events.
Mismatch distributions were performed on species-specific alignments using MEGA version 5 (Tamura et al. 2011) and statistically visualized with siZer (Chaudhui and Marron 1999) to mark significant increases or decreases of slopes around reliable peaks. In complement, the parameter τ (i.e., τ, 2.5 and 97.5 quantiles), representing time in mutational units since expansion, was evaluated using Arlequin 3.5 (Excoffier et al. 2005) on species-specific alignments and alignments including the two species. Comparison between total τ distribution and the species-specific ones identified species with lower τ and thus more recent expansion.
Results
Reads Classification
The 454 sequencing produced 667,485 reads with a mean size of 385.9 bp in Ae. cylindrica, representing up to 2.7% of 1C genome coverage, and 646,327 reads with a mean size of 388.8 bp in Ae. geniculata, covering of up to 2.5% of the 1C genome (table 1).
Proportions of 454 Reads Corresponding to Known TEs, Organelle, Coding, and Low Complexity (SSR) Sequences
| Genome fraction | Aegilops cylindrica (9398 Mb 1C) | Aegilops geniculata (10074 Mb 1C) |
|---|---|---|
| TEs | 71.3% | 72% |
| Organelle | 4.6% | 4.7% |
| Coding sequences | 1.4% | 1.4% |
| SSR | 0.3% | 0.6% |
| Unclassified | 22.4% | 21.3% |
| Total number of 454 reads | 667,485 | 646,327 |
| Genome fraction | Aegilops cylindrica (9398 Mb 1C) | Aegilops geniculata (10074 Mb 1C) |
|---|---|---|
| TEs | 71.3% | 72% |
| Organelle | 4.6% | 4.7% |
| Coding sequences | 1.4% | 1.4% |
| SSR | 0.3% | 0.6% |
| Unclassified | 22.4% | 21.3% |
| Total number of 454 reads | 667,485 | 646,327 |
BLASTN against the various databases classified approximately 80% of the reads in both species, whereas slightly more than 20% of the reads remained unclassified. A total of 475,620 and 465,289 reads corresponded to known TEs in Ae. cylindrica and Ae. geniculata, respectively, representing more than 70% of the sequences. In contrast, only 1.4% of the reads were identified as coding sequences.
Identified LTR Retrotransposons
Among the 454 reads corresponding to the TE genome fraction, five TE orders were identified: The most abundant were LTR retrotransposons, representing 81.46% and 84.56% of the TEs in Ae. cylindrica and Ae. geniculata, respectively (supplementary table S1, Supplementary Material online). Terminal inverted repeat (TIR) transposons accounted for 17.01% and 13.92%, respectively. Much fewer reads were classified as long interspersed nuclear elements (0.56% for both species), short interspersed nuclear elements (0.07% and 0.06%, respectively), and Helitron (0.09% and 0.08% respectively).
More than 400 TE families were identified with 160 and 165 LTR retrotransposons as well as 177 and 155 TIR transposons families in Ae. cylindrica and Ae. geniculata, respectively (supplementary table S4, Supplementary Material online). Among the LTR retrotransposon families, 53% and 25% to 27% corresponded to Gypsy and Copia elements, respectively (supplementary table S1, Supplementary Material online). A total of 44 families were present at more than 0.1% of the reads, representing the most abundant families (fig. 2, supplementary table S2, Supplementary Material online) and including all families making at least 50% of the two Aegilops genomes.
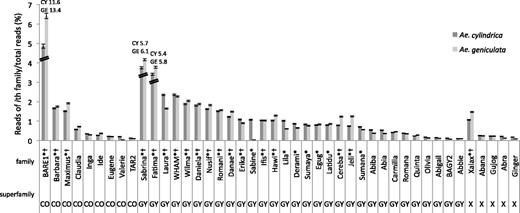
Contribution of 44 major LTR retrotransposon families to 454 reads in Aegilops cylindrica (CY, dark gray) and Ae. geniculata (GE, light gray) with 95% confidence interval estimated by resampling. Families are grouped according to their superfamilies: CO, copia; GY, gypsy; X, unclassified retrotransposon. *,†mark TE families making at least 50% of the genome complement of Ae. cylindrica and Ae. geniculata, respectively. Proportions for BARE1, Fatima, and Sabrina are not at scale and are indicated by values.
The BARE1 clade (BARE1, WIS, and Angela) contributed the most to the overall genome, with around 12% of the total number of reads, and was significantly more abundant in Ae. geniculata (13.4%) than in Ae. cylindrica (11.6%). Sabrina and Fatima represented as much as 5–6% of the total number of reads, showing higher proportions in Ae. geniculata than in Ae. cylindrica. Several TE families presented a similar pattern (e.g., Maximus, Cereba, Hawi, and Xalax), whereas others showed significantly higher proportions of reads in Ae. cylindrica than in Ae. geniculata (e.g., Laura, Derami, Erika, and Lila). The LTR retrotransposon family with the largest difference between species was Sabine, with more than 7,000 reads (1.06%) in Ae. cylindrica, but only 274 (0.04%) in Ae. geniculata.
Twenty-seven LTR retrotransposon families presented sufficiently large amounts of reads matching the 5′-end of the LTR region to be reliably aligned and analyzed through phylogenetics and molecular population genetics.
Phylogenetic Inferences
Maximum likelihood trees evaluated to what extent TE families present species-specific TE copies sharing high genetic similarity and forming clades of insertions (table 2, supplementary fig S1, Supplementary Material online). Most trees resolved clades of TE copies from both species and, to a certain extent, species-specific clades of insertions with well-supported branches (bootstrap support > 60). Phylogenetic trees were classified into four main topologies (fig. 3): 1) trees with few, but unambiguous species-specific clades of insertions (Tree I; e.g., Daniela and Lila, fig. 3a); 2) trees composed of several species-specific clades of insertions (Tree II; e.g., BARE1 and Romani, fig. 3b); 3) trees with a majority of clades encompassing the two species, although a couple of species-specific clades of copies were observed (Tree III; e.g., Maximus and WHAM, fig. 3c); and 4) trees displaying only mixed-species clades of insertions (Tree IV; Egug, Sabrina, and Hawi, fig. 3d).
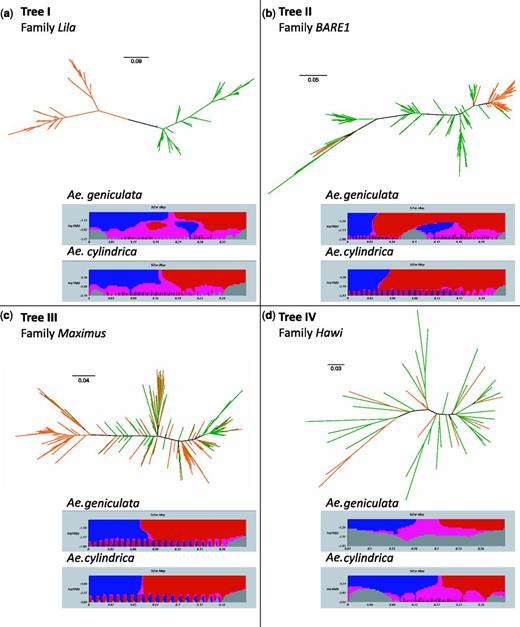
Examples of phylogenetic relationships among copies of LTR retrotransposon families in Aegilops cylindrica (green) and Ae. geniculata (orange). Unrooted accelerated maximum likelihood trees distinguish four main topologies: (a) trees with only few species-specific clades of insertions as shown by the Lila family (referred as Tree I), (b) Tree II is composed of several species-specific clades of insertions, such as the family BARE1, (c) Tree III with only few species-specific clades but preponderant mixed-species clades of insertions, as shown by the Maximus family, and (d) families such as Hawi showing only mixed-species clades of insertions (Tree IV). Scale bar represents the branch lengths. In each panel, the distribution of distances among sequences from species-specific alignments (i.e., mismatch distribution) is shown using blue and red for significantly positive and negative slopes respectively.
Evolutionary Genetics of Copies of LTR Retrotransposons in Aegilops cylindrica (CY) and Ae. geniculata (GE)
| Name | Alignmenta | KST | Treeb | CY Mismatch Distributionc | GE Mismatch Distributionc | τd | π CYe | π GEe |
|---|---|---|---|---|---|---|---|---|
| Daniela | 300/23/27 | 0.7921* | I | 1 | 2 | — | 0.04 | 0.10 |
| Lila | 180/47/35 | 0.6505* | I | 1 | 2 | — | 0.14 | 0.18 |
| Xalax | 150/14/37 | 0.4449* | I | 2 | 1 | — | 0.12 | 0.15 |
| BARE1 | 300/286/133 | 0.3013* | II | 1 | 2 | GE | 0.06 | 0.03 |
| Carmilla | 300/28/27 | 0.2166* | II | 1 | 2 | GE | 0.14 | 0.12 |
| Romani | 300/23/59 | 0.2121* | II | 2 | 1 | CY | 0.09 | 0.09 |
| Fatima | 300/187/147 | 0.1386* | II | 1 | 2 | GE | 0.04 | 0.05 |
| Danae | 295/58/149 | 0.3162* | II | 1 | 1 | GE | 0.19 | 0.16 |
| Gujog | 250/20/29 | 0.3126* | II | 1 | 1 | GE | 0.12 | 0.06 |
| Barbara | 300/65/90 | 0.2056* | II | 1 | 1 | — | 0.08 | 0.06 |
| WHAM | 300/71/71 | 0.2606* | III | 1 | 1 | — | 0.11 | 0.10 |
| Cereba | 300/97/180 | 0.1117* | III | 1 | 1 | — | 0.05 | 0.06 |
| Maximus | 300/162/204 | 0.0915* | III | 1 | 1 | — | 0.04 | 0.06 |
| Eugene | 276/50/43 | 0.076* | III | 1 | 1 | — | 0.10 | 0.11 |
| Ginger | 250/22/11 | 0.0528* | III | 1 | 1 | — | 0.10 | 0.10 |
| Derami | 300/82/97 | 0.0376* | III | 1 | 1 | — | 0.09 | 0.13 |
| Abia | 200/35/20 | 0.0362* | III | 1 | 1 | — | 0.07 | 0.08 |
| Romana | 300/22/21 | 0.0306* | III | 1 | 1 | — | 0.06 | 0.10 |
| Quinta | 300/43/75 | 0.0249* | III | 1 | 1 | — | 0.06 | 0.06 |
| Wilma | 250/51/46 | 0.0238* | III | 2 | 1 | — | 0.08 | 0.08 |
| Jeli | 285/24/44 | 0.0227* | III | 1 | 1 | — | 0.09 | 0.12 |
| Nusif | 280/85/166 | 0.0194* | III | 2 | 1 | — | 0.11 | 0.10 |
| Claudia | 300/32/51 | 0.0141* | III | 2 | 1 | — | 0.08 | 0.08 |
| Egug | 288/48/83 | 0.0230* | IV | 1 | 1 | — | 0.09 | 0.10 |
| Sabrina | 225/307/245 | 0.0078 | IV | 1 | 1 | — | 0.06 | 0.07 |
| Hawi | 195/40/11 | 0 | IV | 1 | 1 | — | 0.18 | 0.18 |
| Sabine | 300/128/5 | 0 | IV | 1 | 1 | — | 0.06 | NA |
aLength of the sequence alignment from both species/number of reads in CY/number of reads in GE.
bTopology of the maximum likelihood tree.
cNumber of significant peaks detected in the mismatch distribution identified in the species-specific alignments.
dSpecies with a significantly lower time since expansion (τ) than the other species and the total alignment, nonsignificant (—).
eNucleotide diversity (π) among copies within each species.
*P < 0.05.
Genetic Differentiation between TE Populations
Genetic differentiation between TE populations (i.e., host genomes), as assessed by KST, varied dramatically depending on the TE family considered, ranging from 0 for Hawi to 0.79 for Daniela (table 2). Several TE families, such as Daniela, Lila, Romani, or Xalax showed KST > 0.2, meaning that more than 20% of the total genetic diversity among inserted TE copies is due to differences between species. Several other TE families presented lower differentiation (KST from 0.2 to 0.025; e.g., Fatima and Maximus) or nonsignificant KST (e.g., Sabrina and Egug). Accordingly, most populations of LTR retrotransposons showed intermediate KST values indicative of similar TE copies shared among species together with species-specific groups of copies.
Molecular Signature of TE Expansion
Analyses of mismatch distribution between TE copies (i.e., distance among sequences and time since expansion, τ) detected families with recently expanded clades of insertions (table 2). Most TE families revealed unimodal distributions of pairwise differences within species and nonsignificantly different τ (supplementary fig. S1 and Supplementary Data, Supplementary Material online). Bimodal distribution and lower τ in one of the two species provided evidence of recent proliferation of specific families in Ae. cylindrica (e.g., BARE1, Carmilla, and Fatima) or in Ae. geniculata (e.g., Romani).
Recently Active versus Quiescent TE Family
Evidence based on the ML tree topology and genetic differentiation (KST), distributions of pairwise differences, and τ among TE populations congruently highlighted LTR retrotransposon families presenting TE copies with particularly high sequence similarity (table 2). Taken together, these parameters distinguish recently active from quiescent TEs. In particular, Daniela, Lila, and Xalax presented ML trees with well-supported species-specific clades (Tree I), high KST, and bimodal mismatch distributions, offering convincing signs of proliferation during species divergence. Correspondingly, BARE1, Carmilla, Romani, and Fatima presented signs of recent proliferation, although ML trees showed several independent species-specific clades (Tree II). Three families (Claudia, Nusif, and Wilma) exhibited bimodal distributions of pairwise distance among sequences but ML trees with mostly mixed-species clades of insertions (Tree III), intermediate KST, and similar τ. Such a syndrome would be congruent with old TE proliferation overlaid by more recent expansion. Finally, three families, Egug, Sabrina, and Hawi, presented ML trees with mixed-species clades only (Tree IV) and low KST, indicating quiescence during species divergence.
Discussion
LTR retrotransposons represent the prevalent component of most plant genomes in relation with ancient or recent transpositional activity, but much remains to be determined about the induction and the rate of transposition as well as other processes shaping the genome-wide TE landscape (Brookfield 2005a; Tenaillon et al. 2010). In that context, low coverage sequencing of randomly distributed fragments across the genome represents an efficient strategy to address variation in TE fractions through bioinformatics methods (Xing et al. 2013). Here, the sequencing of 2.5% of Aegilops genomes was sufficient to survey genome-wide copies of several abundant TEs, including characteristic families from pericentromeric regions (e.g., Cereba; Dvorak 2009). Our method not only identifies and quantifies TE families inhabiting genomes, as otherwise performed in various Eukaryote taxa (e.g., Macas et al. 2007; Wicker et al. 2009; Sun et al. 2012; Estep et al. 2013), but further infers the evolutionary dynamics of several retrotransposon families by comparing individual copies from multiple genomes through appropriate population genetics approaches. It can be straightforwardly extended to include interindividual variance. Provided that detailed knowledge of TEs inhabiting genomes is accessible at the family level, this procedure can thus be applied to abundant TEs of any genome surveyed with short-read sequencing (i.e., so called next-generation sequencing). It allows to further understanding the evolution of dynamic genomes by distinguishing recently active from quiescent TE families without having to produce complete genomes. Future work on fully assembled, high-quality genomes may further confirm the accuracy of this procedure.
Composition of the TE Genome Fraction in Wild Wheats
The analysis of 454 reads from Ae. cylindrica and Ae. geniculata provided valuable information on the genome-wide composition of the TE fraction at the family level that is consistent with the one reported in closely related species from the Triticeae (Li et al. 2004; Choulet et al. 2010; Middleton et al. 2012) or even maize (Schnable et al. 2009). Aegliops indeed have complex genomes with a minor genic component encompassed with more than 70% of TEs, including at least 80% of LTR retrotransposons from up to 165 different families.
Most TE families such as Barbara or Claudia represented slightly distinct proportions of the genomes of the Aegilops investigated here, whereas a couple of TEs were very contrasted (fig. 2). In particular, Sabine (i.e., a moderately abundant LTR retrotransposon in Hordeum vulgare, Wicker et al. 2009) presented more than 7,000 reads in Ae. cylindrica when compared with only 274 in Ae. geniculata. Most LTR retrotransposon families were more abundant in either Ae. cylindrica or Ae. geniculata, representing one line of evidence suggesting that the different TEs from Triticeae followed contrasted amplification trajectories after the origin of species.
As a whole, the present snapshot offers a detailed description of the TE fractions, showing that only a small proportion of the LTR retrotransposon families (∼40) are abundant in wild wheats (fig. 2). In particular, 25 and 18 families sum up to more than 50% of the genome of Ae. cylindrica and Ae. geniculata, respectively (fig. 2), as expected from other Triticeae (Sabot and Schulman 2009). In striking contrast to compact genomes such as rice or Arabidopsis, the genomes of Aegilops and apparently of other Triticeae thus present a moderate diversity of TEs, dominated by a couple of very abundant families (Baucom et al. 2009; Tenaillon et al. 2011).
Evolutionary Dynamics of LTR Retrotransposons in Wild Wheats
Replicative proliferation of LTR retrotransposons gives rise to a population of closely related TE sequences within genomes (Casacuberta et al. 1997; Brookfield 2005b). Comparing variation of TE copies (here, 300 bp at the 5′-end of LTR regions) among host genomes (i.e., TE populations) with molecular population genetics allows distinguishing TE families that remained quiescent or that recently proliferated.
Among the 27 major LTR retrotransposon families studied here in detail (table 2), only three (i.e., Sabrina, Egug, and Hawi) presented copies with similar sequences in both host genomes, indicating low levels of transposition (i.e., quiescence) during the divergence of Ae. cylindrica and Ae. geniculata. In contrast, most retrotransposon families showed complementary evidence of recent proliferation with phylogenetic trees resolved in species-specific clades of insertions, high genetic differentiation among populations (KST), and molecular signature of expansion (mismatch distributions). Accordingly, independent transposition of several TE families likely occurred during the divergence of host genomes. In particular, Lila, Daniela, and Xalax showed high KST, signature of recent expansion, and trees with two distinct species-specific clades, suggesting that they proliferated from one or few master copies. Seven families (i.e., BARE1, Barbara, Carmilla, Fatima, Gujog, and Romani) revealed similar patterns but showed several species-specific clades of TE copies, suggesting proliferation from multiple insertions (i.e., transposon model; Brookfield and Johnson 2006).
Noticeably, abundant TE families such as BARE1 or Fatima showed evidence of recent proliferation in wild wheats, but Sabrina was revealed here as quiescent. Congruently, BARE1 and Fatima have been reported active in several related species, supporting continuous transposition during the divergence of host genomes, whereas Sabrina was reported as quiescent in Ae. speltoides and probably proliferated at a more distant past (Vicient et al. 1999, 2001; Kalendar et al. 2000; Belyayev et al. 2010). Abundance of TE may thus be a misleading proxy for transpositional activity, even for recently active TEs. For instance, BARE1 and Fatima are more abundant in Ae. cylindrica, but evidence reported here indicates that they proliferated more recently in Ae. geniculata.
Differential Evolutionary Trajectories of Retrotransposons and Host Genome Evolution
The present results indicate that the transpositional activity of TE families is species specific to a large extent. Choulet et al. (2010) assessed that TE families amplified in cultivated wheat following different waves during the last 4 Myr, with most bursts having occurred around 1.5 Ma. Accordingly, BARE1, Daniela, Fatima, Lila, and Romani (and Barbara, Cereba, Gujog, Jeli, Maximus, Quinta, WHAM, and Wilma to a certain extent) present evidence of parallel amplifications in wheat and wild wheats. In contrast, Egug and Sabrina were detected as recently active in domesticated wheat but quiescent in wild wheats, whereas Derami and Nusif amplified in Aegilops but not in wheat.
Most abundant LTR retrotransposon families investigated here in two Aegilops species present evidence of proliferation along with species differentiation, highlighting the importance of TE dynamic in shaping the diversity of Triticeae genomes (Bennetzen 2005; Vitte and Panaud 2005; Brenchley et al. 2012). In particular, wild wheats and domesticated wheat show similar TE genome fractions but contrasted abundances and evolutionary dynamics of several LTR retrotransposon families. Accordingly, this survey indicates that ancestral TE families followed independent evolutionary trajectories among related species, highlighting the evolution of TE populations as a key factor of genome differentiation. The mechanisms behind such differential dynamics of TE families among species deserve further attention. To what extent the incomplete sorting of a particularly diversified ancestral pool of TEs or the continuous diversification of TE families along with the evolutionary divergence of host genomes explains differences in the LTR retrotransposon composition remains poorly known (Jurka et al. 2011). Moreover, the relative importance of intrinsic properties of TEs and of mechanisms acting at the host level should be further considered (Tenaillon et al. 2010). The effective approach described here uses information from short reads sequences to ultimately understand the forces shaping TE landscape and genome architecture. In particular, species of the Triticeae tribe evolved through series of hybridization and polyploidy events (Feldman and Levy 2012) and investigating to what extent TE dynamics is associated with the origin of polyploid lineages is a crucial issue (Parisod and Senerchia 2012).
Acknowledgments
The authors thank Maud Tenaillon, Julien Vieu, and four anonymous reviewers for constructive comments on the manuscript. This work was supported by the Swiss National Science Foundation through the National Centre of Competence in Research “Plant Survival” and a grant (PZ00P3-131950 to C.P.).
Literature Cited
Author notes
Associate editor: Ellen Pritham
