


Abstract
The transition from endosymbiont to organelle in eukaryotic cells involves the transfer of significant numbers of genes to the host genomes, a process known as endosymbiotic gene transfer (EGT). In the case of plastid organelles, EGTs have been shown to leave a footprint in the nuclear genome that can be indicative of ancient photosynthetic activity in present-day plastid-lacking organisms, or even hint at the existence of cryptic plastids. Here, we evaluated the impact of EGT on eukaryote genomes by reanalyzing the recently published EST dataset for Chromera velia, an interesting test case of a photosynthetic alga closely related to apicomplexan parasites. Previously, 513 genes were reported to originate from red and green algae in a 1:1 ratio. In contrast, by manually inspecting newly generated trees indicating putative algal ancestry, we recovered only 51 genes congruent with EGT, of which 23 and 9 were of red and green algal origin, respectively, whereas 19 were ambiguous regarding the algal provenance. Our approach also uncovered 109 genes that branched within a monocot angiosperm clade, most likely representing a contamination. We emphasize the lack of congruence and the subjectivity resulting from independent phylogenomic screens for EGT, which appear to call for extreme caution when drawing conclusions for major evolutionary events.
The photosynthetic organelles of plants and algae (plastids) are the product of endosymbioses, where once free-living organisms were engulfed and retained by eukaryotic host cells (Reyes-Prieto et al. 2007; Gould et al. 2008). Initially, primary endosymbiosis involved the integration of a photosynthetic prokaryote related to modern-day cyanobacteria, most likely in the common ancestor of glaucophytes, red algae, and green plants (green algae and land plants), resulting in the Plantae supergroup (Palmer et al. 2004). Subsequently, primary plastids spread to other eukaryotes by means of secondary endosymbioses, where a green or red alga was taken up by another lineage, and the process was repeated yet again as tertiary endosymbioses in some dinoflagellates (Keeling 2010).
Plastid genomes rarely encode more than 200 proteins, which represent a small fraction of the proteins required for full functionality, and an even smaller fraction of the few thousand proteins found in modern-day cyanobacteria (Martin et al. 1998). It is widely assumed that most endosymbiont genes were either lost or transferred to the host nucleus during the course of plastid integration (Lane and Archibald 2008). This migration of genes between two genomes is known as endosymbiotic gene transfer (EGT), a special case of horizontal gene transfer (HGT). The products of the transferred genes that are essential for plastid function are targeted back across the plastid membranes to reside in their original compartment, a process that played a fundamental role in the integration of endosymbiont and host (Patron and Waller 2007). However, not all nucleus-encoded genes inferred to be of endosymbiotic origin are plastid targeted; in the land plant Arabidopsis thaliana, for example, >50% of identified EGTs have evolved functions unrelated to the plastid (Martin et al. 2002).
The impact of EGTs on the host nuclear genome is generally considered to be significant. Estimates for cyanobacterial genes in the nucleus range from 6% in the green alga Chlamydomonas reinhardtii (Moustafa and Bhattacharya 2008), to about 11% in the glaucophyte Cyanophora paradoxa (Reyes-Prieto et al. 2006), and to as high as 18% in A. thaliana (Martin et al. 2002). Secondary endosymbioses complicate the prediction of EGTs because not only the host nucleus potentially integrated genes from the secondary plastid, but also from the nucleus of the green or red algal endosymbiont, itself the recipient of cyanobacterial genes previously transferred from the primary plastid (Archibald 2009). Nevertheless, genome-scale analyses have begun to analyze the extent of EGTs in taxa with plastids of secondary origin, with complex and sometimes contradictory results. Diatoms possess a red algal plastid, and in Phaeodactylum tricornutum 171 genes (1.6% of the gene catalog) were predicted to be of red algal origin (Bowler et al. 2008). A much less anticipated result came from another analysis of diatoms, which suggested that over 1700 genes, representing 16% of the nuclear genes, were derived from green algae, compared with only about 400 genes with red algal affinity (Moustafa et al. 2009). A green phylogenetic signal of such magnitude led Moustafa et al. (2009) to build on other similar findings of fewer genes (Becker et al. 2008; Frommolt et al. 2008) and propose that these genes are in fact evidence of an ancient, cryptic green algal endosymbiont predating the acquisition of the red algal plastid that we observe today.
A similar approach was employed to study the phylogenetic origins of Chromera velia expressed nuclear genes (Woehle et al. 2011). Chromera velia has attracted much attention because it is a photosynthetic relative of apicomplexan parasites, whose highly reduced, non-photosynthetic plastid has been a puzzling evolutionary issue (Moore et al. 2008; Janouskovec et al. 2010; Obornik et al. 2011). Woehle et al. (2011) produced 29,856 contigs from a 454 Titanium GS FLX (Roche) cDNA sequencing, of which they drastically reduced the redundancy to 3,151 clusters. As expected for an alga with a red algal-derived plastid, 263 genes were found to indicate a red photosynthetic ancestry, but they also found a prominent signal of 250 genes apparently reflecting a green ancestry (Woehle et al. 2011). In this case, however, the authors cautiously attributed this signal to limited sampling of red algal genomes and phylogenetic artifacts rather than to a green endosymbiont, as in the diatom analysis (Moustafa et al. 2009).
In a Blast-based survey of C. velia clusters, we found indication of contamination from land plants (specifically from monocots). This prompted us to re-evaluate the ratio of putatively red and green genes in C. velia using a slightly different phylogenomic protocol (see Materials and Methods), which allowed us to investigate how methodological variations can affect the phylogenomic profiles of the same dataset. To identify putative red or green algal genes in C. velia, we first generated maximum likelihood phylogenetic trees for 2,146 genes and automatically searched for topologies consistent with EGT. This procedure identified 362 genes showing exclusive affinity between secondary plastid-bearing lineages (including C. velia) and red algae, viridiplantae (green algae and/or land plants), or glaucophytes (bootstrap support ≥80%). This represented our initial pool of candidate genes for EGT. As controls, we also evaluated the signal uniting C. velia with alveolates (apicomplexans, dinoflagellates, and/or ciliates), which are closely related to C. velia and therefore expected to be the dominant signal. We found C. velia united with alveolates in 448 trees. Lastly, we scanned our set of trees for monophyletic grouping between C. velia and prokaryotes, and identified 53 cases as possible evidence of HGT.
At face value, these figures might be taken to suggest a large contribution of EGT to the C. velia genome. However, automated computational pipelines used for searching HGT/EGT in genomic data can be misleading and detailed curation of the resulting phylogenies is absolutely necessary to avoid false positives. In the case of hypothetical EGT from red or putative cryptic green endosymbionts, the expected relationships are known: the transferred genes should be most closely related to either red or green algae (ideally nested within either group if a diverse sample of algal sequences is available) to the exclusion of all other eukaryotic or prokaryotic groups. If the genes were ancestrally derived from the cyanobacterial progenitor that gave rise to the primary plastids in red and green algae, a cyanobacterial outgroup should also be recovered. Realistically, it cannot be expected that such theoretical topologies will be inferred or will be robustly supported for every real case of EGT, even with the help of complex evolutionary models. Indeed, the considerable evolutionary distances, inappropriate taxon sampling, lack of genuine phylogenetic signal, and various artifacts such as compositional biases, extreme rate variation among sites, or heterotachy will negatively impact the resolution of most trees (Philippe and Laurent 1998; Philippe et al. 2005; Lockhart et al. 2006; Jeffroy et al. 2006; Stiller 2011). Accordingly, the conditions for the detailed verification of the trees were slightly relaxed so that more than one algal type was allowed in the monophyly (see Material and Methods).
The above conditions were applied to the initial pool of 362 candidate algal genes to refine the assessment of putative EGT, resulting in a different picture than the automated sort. First, 109 genes (almost one-third of the genes identified as possibly “algal”) showed strong similarity to land plants, with C. velia clearly belonging to a monocotyledon clade (Supplementary fig. S1 and Supplementary Data, Supplementary Material online). It cannot be ruled out that these represent HGTs from land plant to C. velia, but the high level of sequence identity to homologs from monocotyledons (90 C. velia sequences displayed >90% identity, among which 22 showed 100% identity), favors the simpler explanation of a contamination in the C. velia dataset.
More interestingly, out of the remaining 253 candidate genes of algal origin, only 23 were found to support a red algal origin (fig. 1 and supplementary fig. S2, Supplementary Material online; table 1) and 9 supported a green algal origin (fig. 2 and supplementary fig. S3, Supplementary Material online; table 1). An outgroup and representatives of both green and red algae were required to be included in the tree, which are necessary conditions to distinguish between red and green signals. Other genes produced more ambiguous signals because C. velia fell within a clade of mixed algal types: in 11 trees red and green algae were mixed; in 3 trees red and glaucophyte algae were mixed; and in 5 trees red, glaucophyte, and green algae were mixed (fig. 3 and supplementary fig. S4, Supplementary Material online; table 1). The coverage of C. velia in these putative algal genes ranged from 27% to 100% of the length of the trimmed alignments, but for the majority (65%) C.velia covered >90%, limiting possible phylogenetic artifacts associated with incomplete genes (table 1). Finally, 18 trees showing possible evidence of exclusive HGT from bacteria remained after manual curation (supplementary table S2, Supplementary Material online).
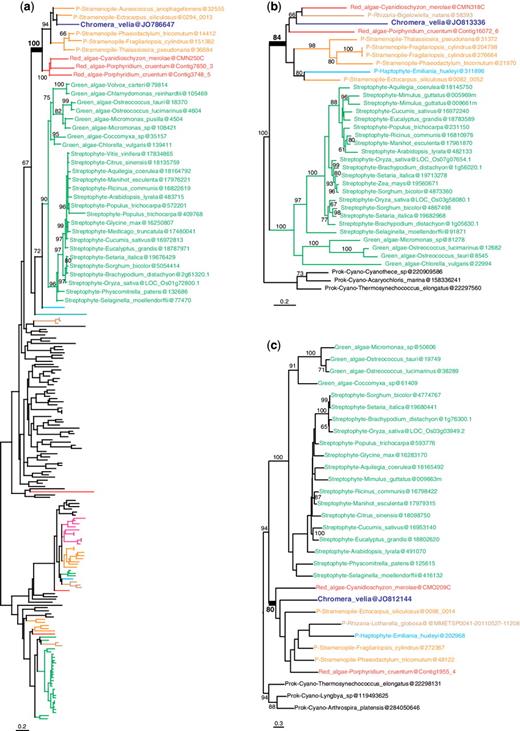
Examples of maximum likelihood trees congruent with EGT from a red algal endosymbiont. (a) Signal recognition particle-docking protein. (b) Folate biopterin transporter. (c) Vitamin k epoxide reductase. Numbers at nodes represent bootstrap proportion; only values higher than 60% are shown. For clarity, only the relevant taxa are shown (complete taxon list is available in Supplementary Material online); branches and taxa are colored according to their taxonomy: dark blue: C. velia; red: red algae; green: viridiplantae; orange: stramenopiles; light blue: haptophytes, cryptophytes; brown: Rhizaria; pink: alveolates; black: prokaryotes, animals, fungi, Amoebozoa. All trees congruent with EGT from a red algal endosymbiont are found in supplementary figure S2 (Supplementary Material online).
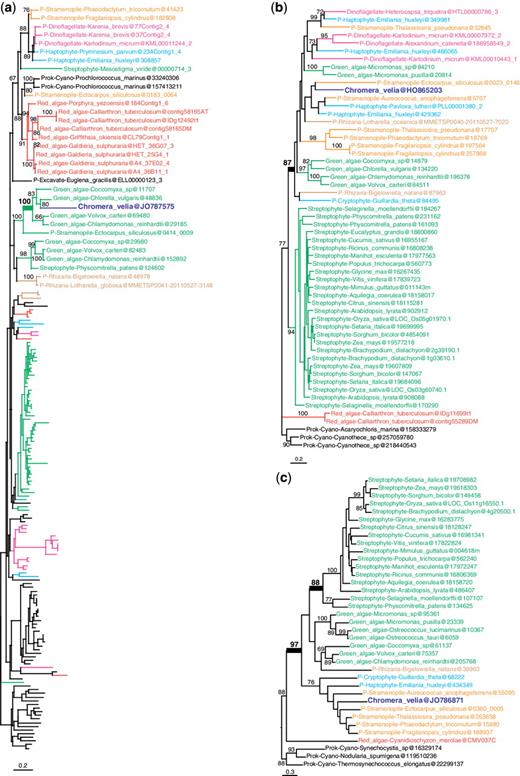
Examples of maximum likelihood trees congruent with EGT from a green algal endosymbiont. (a) Fructose-bisphosphate aldolase c. (b) No function prediction. (c) Gun4 domain protein. Numbers at nodes represent bootstrap proportion; only values higher than 60% are shown. For clarity, only the relevant taxa are shown (complete taxon list is available in Supplementary Material online); branches and taxa are colored according to their taxonomy: dark blue: C. velia; red: red algae; green: viridiplantae; orange: stramenopiles; light blue: haptophytes, cryptophytes; brown: Rhizaria; pink: alveolates; black: prokaryotes, animals, fungi, Amoebozoa. All trees congruent with a green algal origin are found in supplementary figure S3 (Supplementary Material online).
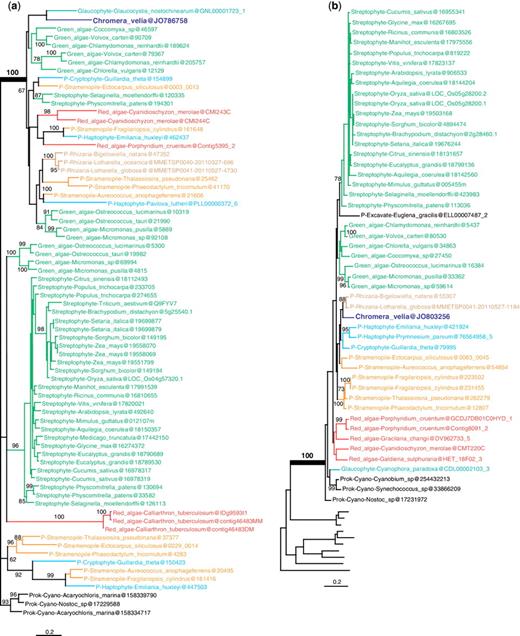
Examples of maximum likelihood trees congruent with EGT from an algal endosymbiont, but the algal type could not be determined. (a) Plastid terminal oxidase. (b) Chlorophyll synthetase. Numbers at nodes represent bootstrap proportion; only values higher than 60% are shown. For clarity, only the relevant taxa are shown (complete taxon list is available in Supplementary Material online); branches and taxa are colored according to their taxonomy: dark blue: C. velia; red: red algae; green: viridiplantae; orange: stramenopiles; light blue: haptophytes, cryptophytes; brown: Rhizaria; turquoise green: glaucophytes; black: prokaryotes, animals, fungi, Amoebozoa. All trees congruent with an algal origin are found in supplementary figure S4 (Supplementary Material online).
Genes with tree topologies concordant with an algal origin
| Seq. ID | Seq. Function | E-value | Algal Origina | Plastid Targetedb | Coveragec |
|---|---|---|---|---|---|
| JO786647 | Signal recognition particle-docking protein | 7.43E-80 | R | Yes | 0.99 |
| JO786663 | NA | 1.15E-99 | R | Yes | 0.99 |
| JO786667 | Ferredoxin (2fe-2s) | 1.94E-40 | R | Yes | 1 |
| JO786670 | ATP-dependent clp proteolytic subunit | 4.89E-90 | R | Yes | 0.98 |
| JO786681 | ATP-dependent clp protease proteolytic subunit | 1.12E-72 | R | Yes | 1 |
| JO786748d | ATP-dependent clp protease proteolytic subunit | 5.54E-112 | R | Yes | 1 |
| JO786683 | Integral membrane protein | 3.24E-77 | R | Yes | 1 |
| JO786729 | NA | 6.57E-37 | R | Yes | 0.98 |
| JO786744 | Fructosamine kinase | 2.96E-87 | R | Yes | 0.98 |
| JO786766d | Tyrosyl-tRNA synthetase | 9.57E-47 | R | Yes | 1 |
| JO786779 | NA | 9.34E-102 | R | Yes | 1 |
| JO789192 | Glycerol-3-phosphate dehydrogenase | 9.79E-118 | R | No | 1 |
| JO790726 | Adenosine trna methylthiotransferase | 2.22E-70 | R | No | 0.53 |
| JO792696 | Nad-dependent epimerase dehydratase | 2.91E-51 | R | No | 0.99 |
| JO803234 | Nad-dependent epimerase dehydratase | 2.74E-140 | R/Gl | No | 1 |
| JO794159 | Oxygen-evolving enhancer protein | 5.78E-51 | R | No | 0.47 |
| JO795745 | Aspartyl glutamyl-trna amidotransferase subunit b | 1.05E-37 | R | No | 0.5 |
| JO800417 | Peptide chain release factor 3 | 0 | R | No | 1 |
| JO805350d | Peptide chain release factor 1 | 1.92E-130 | R | No | 0.96 |
| JO807105d | Electroneutral sodium bicarbonate exchanger 1 | 7.37E-50 | R | No | 0.34 |
| JO807782 | Aldo keto reductase | 9.82E-48 | R | No | 0.97 |
| JO799950 | Aldo keto reductase | 4.99E-75 | R/G | No | 0.87 |
| JO812144 | Vitamin k epoxide reductase | 1.79E-46 | R | No | 1 |
| JO813336 | Folate biopterin transporter | 2.09E-27 | R | No | 0.27 |
| JO813530 | Magnesium chelatase atpase subunit d | 1.90E-127 | R | No | 0.41 |
| JO814400 | Zinc-binding dehydrogenase | 3.01E-46 | R | No | 0.98 |
| HO865203 | NA | 6.57E-49 | G | Yes | 0.73 |
| JO786726d | Coproporphyrinogen iii oxidase | 0 | G | Yes | 0.99 |
| JO786781 | NA | 1.12E-120 | G | Yes | 0.97 |
| JO786871 | Gun4 domain protein | 3.26E-59 | G | Yes | 0.99 |
| JO787575d | Fructose-bisphosphate aldolase c | 1.91E-75 | G | No | 0.76 |
| JO794110 | Light-dependent protochlorophyllide oxido-reductase | 7.19E-41 | G | No | 0.93 |
| JO798116 | Vacuolar atp synthase 16 kda proteolipid subunit | 8.48E-31 | G | No | 0.51 |
| JO803246 | Glucose-methanol-choline oxidoreductase | 1.04E-152 | G | No | 0.99 |
| JO812733d | NA | 1.91E-91 | G | No | 0.54 |
| HO865098 | Flavodoxin | 1.11E-38 | R/G | Yes | 0.99 |
| JO786648 | Uroporphyrinogen decarboxylase | 0 | R/G | Yes | 1 |
| JO786655 | Uroporphyrinogen decarboxylase | 0 | R/G | Yes | 1 |
| JO786721 | Permeases of the major facilitator superfamily | 3.41E-44 | R/G | Yes | 0.96 |
| JO786743 | NA | 3.42E-60 | R/G | Yes | 0.95 |
| JO786758 | Plastid terminal oxidase | 4.12E-87 | R/G | Yes | 0.93 |
| JO786778 | Zeta-carotene desaturase | 5.86E-171 | R/G | Yes | 0.73 |
| JO786874d | Tryptophanyl-tRNA synthetase | 1.72E-71 | R/G | Yes | 0.58 |
| JO793833 | Fe-s metabolism associated | 1.92E-40 | R/G | No | 0.88 |
| JO802386 | Amine oxidase | 1.48E-93 | R/G | No | 0.47 |
| JO803256 | Chlorophyll synthetase | 8.61E-160 | R/G | No | 1 |
| JO806278 | Leucyl aminopeptidase | 4.86E-59 | R/G | No | 0.41 |
| JO806648 | Phosphoserine aminotransferase | 8.53E-92 | R/G | No | 0.98 |
| JO807737 | NA | 6.40E-58 | R/G | No | 0.99 |
| JO814175 | Methyltransferase type 11 | 2.48E-59 | R/G | No | 0.65 |
| JO786792 | Methyltransferase type 11 | 1.20E-102 | R/G/Gl | Yes | 1 |
Note.—Italic characters denote ancient paralogs, that is, duplication occurred in the algal donor, and both copies were possibly acquired via EGT.
aPossible origins in C. velia. R: Red algae; G: Green algae; R/G: Red and/or Green algae; R/Gl: Red and/or Glaucophyte algae; R/G/Gl: Red and/or Green and/or Glaucophyte algae.
bAs inferred in Woehle et al. (2011).
cCoverage is defined here as the length of the C.velia gene fragment divided by the total length of the alignment after masking of the poorly aligned sites (trimal).
dAlso recovered in Woehle et al. (2011).
All in all, detailed inspection of automatically parsed trees recovered a mere 51 genes in this C. velia EST dataset possibly supporting transfers from an algal endosymbiont, although sampling is often so limited as to preclude any strong conclusions about the direction of the transfer. Interestingly, 47% (24/51) of these EGT candidates were also predicted to encode an N-terminal plastid targeting presequence (Woehle et al. 2011), providing an independent evidence of their link to the plastid (table 1). Other aspects of these trees are not so easily explained. For example, 12 genes inferred to be of red algal origin included chlorarachniophytes in the “red” clade, but these algae possess green secondary plastids (Rogers et al. 2007). Although compatible with the nested phylogenetic position of the chlorarachniophyte host among the red algal plastid-containing groups stramenopile, alveolate, and hatophytes (Burki et al. 2007; 2012), it implies additional HGT events either before or after the establishment of its green plastid (Archibald et al. 2003).
Most importantly, however, these analyses show that large-scale phylogenomic pipelines can result in drastic differences: from the same transcriptome data we identified 51 putative algal-derived genes, versus 513 identified by Woehle et al. (2011). But this is only part of the problem, because the overlap in genes identified by the two analyses was only eight genes, meaning that 43 (84%) of the genes that we identified were not recovered by Woehle et al. (2011), whereas 505 (98%) of the genes they identified did not meet our criteria (fig. 4). We see a number of explanations for this discrepancy, some of which compound the effects of others. (1) The database used in Woehle et al. (2011) to populate the phylogenetic trees led to misleading results. Very limited sampling for land plants (only two representatives, A. thaliana and Physcomitrella patens) did not permit to recover the monocot signal in 109 genes, 10 of which were wrongly classified as contributing to the green signal in Woehle et al. (2011) (fig. 4; supplementary table S1, Supplementary Material online). The absence of prokaryotes was also problematic and precluded the identification of several instances of complicated phylogenetic patterns (including non-exclusive HGTs) rather than evidence of red and green signals. Supplementary figure S5 (Supplementary Material online) shows examples of such phylogenies impacted by the inclusion of prokaryotes that do not support an algal ancestry in C. velia, but were inferred to do so in Woehle et al. (2011). (2) The procedure to select the final taxa entering the phylogenetic reconstruction step in Woehle et al. (2011) interfered with the interpretation of the resulting trees. Specifically, all taxa except C. velia, red and green alga, and an outgroup were removed from clusters of homologous sequences prior to the phylogenetic reconstructions, which likely exacerbated the problem outlined above. (3) No statistical support was used to evaluate the robustness of the trees, resulting in many trees showing only weak affinity to red or green algae yet classified as contributing to the overall photosynthetic signal.
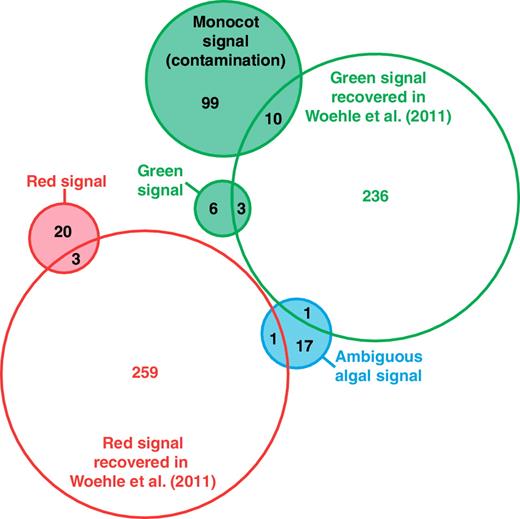
Venn diagram showing the number of overlapping genes between this study and Woehle et al. (2011). The filled circles correspond to the genes recovered in this study.
The case of C. velia is not unique: a number of recent studies have described contrasting reinterpretations of the same datasets. For example, the imposing 1,700 genes inferred to be of green algal origin in diatoms (Moustafa et al. 2009) was reduced to only 144 genes after more stringent criteria were applied, notably the mandatory presence of red algal sequences in the trees (Dorrell and Smith 2011). These differences are important, because the presence of EGTs is not only used to infer the contribution of extant endosymbiotic organelles to their host, but have also been used as evidence for photosynthetic ancestry in plastid-lacking lineages, or even the presence of cryptic plastids. Oomycetes and ciliates are two heterotrophic groups sharing undisputable common ancestry with red algal plastid-containing lineages. In the case of oomycetes, the complete genomes of two Phytophthora species revealed the existence of 855 genes with putative red algal or cyanobacterial origins that were presented as evidence for the ancient presence of a red algal plastid (Tyler 2006). However, a reanalysis of this dataset, specifically testing for EGTs, showed no such evidence for red algal contributions to the oomycete genome (Stiller et al. 2009). Similarly, based on the identification of 16 genes of apparent algal origin in the genomes of Tetrahymena thermophila and Paramecium tetraurelia, ciliates were proposed to have once been photosynthetic (Reyes-Prieto et al. 2008), despite a previous assessment that T. thermophila displayed no signal of plastid descent above the expected background noise (Eisen et al. 2006).
These discrepancies aside, all algae do contain some genes of endosymbiontic origin, raising a fundamental question: How many cases of EGT are enough to be considered evidence for past presence of endosymbionts? There is no clear answer because each lineage is different. For example, a mere seven genes of cyanobacterial or algal origin were identified in the apicomplexan parasite Cryptosporidium parvum (Huang et al. 2004), which lacks a plastid (Abrahamsen 2004). But because Cryptosporidium’s close relatives all possess plastids, these few genes were interpreted as supporting the view that Cryptosporidium evolved from a plastid-containing lineage (Huang et al. 2004). In contrast, over 100 genes of possible algal origin were inferred in the unicellular choanoflagellate Monosiga (Sun et al. 2010), but because there is no other evidence to suggest that choanoflagellates ever had a plastid, these genes were interpreted as HGT, reflecting feeding behaviors rather than plastid losses (Sun et al. 2010).
Another example is the chlamydial footprint found in Plantae; two studies reported that at least 21 and 55 genes, respectively, were transferred between chlamydiae and the ancestor of primary photosynthetic eukaryotes, the majority of which are putatively plastid targeted and as such were proposed to have contributed to the establishment of the cyanobacterial endosymbiont (Huang and Gogarten 2007; Moustafa et al. 2008). But because there is no unambiguous rule to distinguish between HGTs from related sources and EGTs, Huang and Gogarten (2007) interpreted these genes as evidence for an ancient chlamydial endosymbiont, whereas Moustafa et al. (2008) raised the possibility that mixotrophy and multiple HGTs may have instead played an important role. Overall, independent phylogenomic analyses are not only leading to different results, but often reach different conclusions based on similar results.
These contrasting cases are symptomatic of the current situation and attest that the interpretation of unexpected phylogenetic patterns is often subjective and influenced by a priori expectation. They call for a better use of experimental controls and explicit testing of predictions of HGTs/EGTs to distinguish between genuine signal and noise (Stiller 2011). The task of analyzing thousands of trees that genome data have made possible is complex and improved methods need to be developed to help identifying the trees that strongly support the HGTs/EGTs scenarios under investigation. Increasing availability of genomic data for key taxa will permit us to specifically test these scenarios and examine alternative explanations for phylogenetic signal deviating from vertical inheritance.
Materials and Methods
A workflow diagram describing the procedure of sequence retrieval, alignment, tree reconstruction, and sorting can be found in supplementary figure S6 (Supplementary Material online). Chromera velia 3,151 clusters from Woehle et al. (2011) were used as query in a BLASTP search against protein sets from complete genomes and EST datasets (see supplementary table S3, Supplementary Material online for the complete list of taxa included in the analysis). CDHIT (Li and Godzik 2006) was used to reduce redundancy within each protein dataset prior to Blast in order to facilitate the subsequent tree interpretation by removing recent paralogs (clustering threshold: 90% identity). The Blast output was then parsed with a stringent e-value threshold of 1e-20 to minimize the inclusion of paralogs and hits were collected for each C. velia protein and multiple fasta files created. To prevent the inclusion of several closely related prokaryotic species, only the three best hits in each prokaryotic group were included (supplementary table S3, Supplementary Material online). MAFFT-LINSI (Katoh et al. 2005) was used for aligning sequences and TRIMAL (Capella-Gutiérrez et al. 2009) for selecting aligned positions, with sites containing more than 10% of gaps removed. Multiple sequence alignment files with less than five species were discarded at this stage. RAxML 7.2.8 (Stamatakis 2006) was used to reconstruct trees, with the LG substitution matrix + Γ4 + F evolutionary model and 100 bootstrap replicates.
This approach resulted in 2,143 trees containing at least five species (including C. velia). The pre-sorting of these trees was first done automatically with a text-parsing Perl script used in Chan, Reyes-Prieto, et al. (2011) and Chan et al. (2011), with the initial condition that C. velia be monophyletic with members of plants (red algae, green algae, streptophytes, and/or glaucophytes) and/or members of secondary plastid-bearing lineages of alveolates, stramenopiles, Rhizaria, haptophytes and cryptophytes, and/or Cyanobacteria (supplementary table S3, Supplementary Material online). An arbitrary bootstrap threshold of 80% was applied to restrict the sorting to trees with moderate to high statistical support. This constituted the initial pool of EGT candidates with 362 trees. We also extended the condition to include the plastid-lacking stramenopiles (oomycetes, Blastocystis), alveolates (ciliates), and Rhizaria (Reticulomyxa filosa, Gromia sphaerica, and Paracercomonas longicauda) to account for the prediction that endosymbioses might have occurred in their common ancestors, but found no additional trees. Then, we manually scanned each tree for topologies consistent with EGTs and discarded the ones that did not contain at least C. velia, red and green algal representatives, and an outgroup. We used prokaryotic lineages as outgroup when possible, or alternatively members of animals, Fungi, or Amoebozoa. We also discarded trees with ≤10 taxa to reduce potential phylogenetic artifacts associated with poor taxon sampling (which ultimately did not contribute to the differences between our results and those of Woehle et al. [2011] ). In parallel, we also evaluated the extent of land plant contamination by pooling the trees showing C. velia nested within monocotyledons (bootstrap support ≥80%). Finally, we monitored the alveolate and prokaryotic signals from the remaining 1,781 trees by searching for exclusive monophyletic grouping including C. velia and apicomplexans, dinoflagellates and/or ciliates, and C. velia and prokaryotes (bootstrap support ≥ 80%). Functional annotation of the EGT candidates was done with BLAST2GO (Götz et al. 2008).
Acknowledgments
We thank Sven B. Gould for sharing the C. velia cluster. This work was supported by a grant from the Natural Sciences and Engineering Research Council of Canada (227301) to P.J.K., by a grant from the Tula Foundation to the Centre for Microbial Diversity and Evolution, by the Czech Science Foundation, projects P506/12/1522 and P501/12/G055 to M.O., the Praemium Academiae award to J.L., and by Award IC/2010/09 made by the King Abdullah University of Science and Technology (KAUST) to A.P., M.O., and J.L. P.J.K. and J.L. are Fellows of the Canadian Institute for Advanced Research.
Literature Cited
Author notes
†These authors contributed equally to this work.
Associate editor: Bill Martin
